
What is World Energy Review?
In engineering, you will see that there are lots of RELEVANT Rerports for your industry, depending on the tyep of course. Most of them come from the most relevant companies or key leaders, for instance:
- Deloitte, KPMG, PwC, Accenture, McKinsey BCG as well as companies such as: BP, ExxonMobile, Shell, Chevron, Total, etc…
The reports are used mostly for informational purposes as well as trying to control the narrative of the intended purpose of the companies/industries.
In the Oil&Gas Industries, which have now shifted to a “friendly name” such as Energy Industry, are now focusing their attention to global energy re-structuring.
So, What is the Statistical World Energy Review 2023 Report?
In short:
- The Statistical Review analyses data on world energy markets from the prior year.
- It has been providing timely, comprehensive and objective data to the energy community since 1952.
- The Energy Institute is preserving and building on the Statistical Review’s legacy in collaboration with others.
- bp is providing continuing support and, as the EI’s Partners for the Statistical Review, KPMG and Kearney are also committing funding and sector expertise.
It covers this main points:
- Energy Trends, consumption/production
- Oil, Gas, Coal
- Renewables
- Carbon Emissions
- Electricity
- Rare Metals & EV
In this blog post, we will cover the basic points or highlights so you get aquainted with the report, but more importantly, with World Energy Trends. It is a summary of a summary of a summary! If you want to learn more about this topic, for sure enroll in the course!
If you want a MUCH DEEPER DIVE into this topic, I prepared a Course on this specific report, it is focused towards analysis/review of the content, lots of input on my behalf if you want to check it out.

1. World Energy (Primary Energy)
This is by far the most important point, as we cover how Energy is used in the World.
Key Highlights:
- 2022 five stories from the data
Post-COVID, transport fuel demand patterns continued to return, but with major variations across geographies and fuel types. - The Ukraine conflict precipitated record international gas prices and unprecedented shifts in global oil and gas trade flows.
- Record deployment of wind and solar in the power sector accounted for around 84% of net electricity growth.
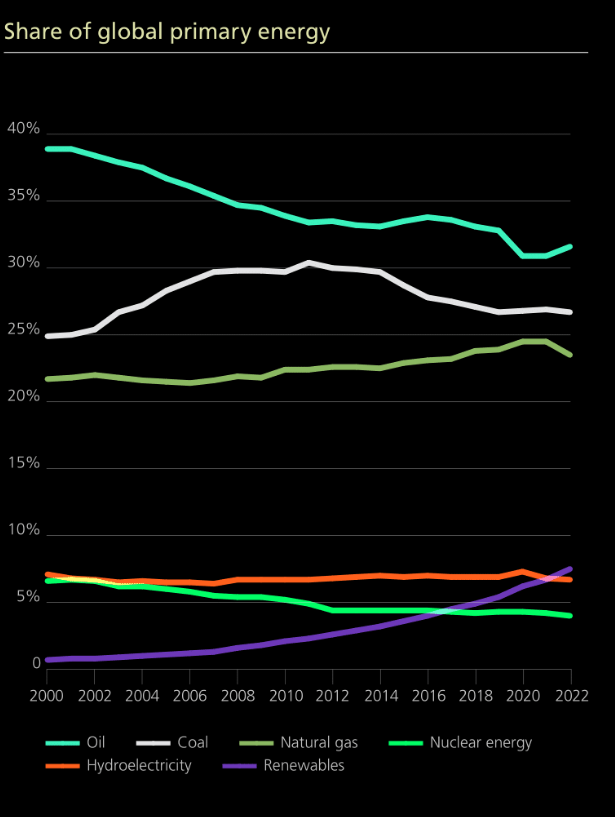
- Global primary energy consumption grew by 1%, with the dominance of fossil fuels barely dented at 82%.
- Global energy-related emissions continued to grow, up 0.8%, with use of higher carbon fuels negating strong growth in renewables.
![[UDEMY] Oil & Gas Energy Review 2021 Webinar](https://chemicalengineeringguy.com/wp-content/uploads/elementor/thumbs/UDEMY-Oil-Gas-Energy-Review-2021-Webinar-p6cx7ambv8wv6h8v3eb0ytrtccsyizz43806o4bt9g.png "[UDEMY] Oil & Gas Energy Review 2021 Webinar")
More Keypoints:
- 2022 saw a 1% increase in total primary energy consumption
- taking it to around 3% above the 2019 pre-COVID level.
- Renewables (excluding hydroelectricity) share of primary energy consumption reached 7.5%
- an increase of nearly 1% over the previous year.
- Fossil fuel consumption as a percentage of primary energy:
- remained steady at 82%
- Primary energy demand growth slowed compared to 2021
- increasing 1.1% (6.6 EJ) in 2022
- compared to 5.5% (31 EJ) in 2021.
- Primary energy in 2022 was:
- 16 EJ above 2019 pre-COVID levels
- with consumption increasing in all regions apart from Europe (-3.8%) and CIS (-5.8%).
The report includes sevearl changes in consuption/production of fuels and regions. Here is a good example of how General Fuel Energy has been changing with respect to the last years:

2. Oil, Gas & Coal
- This is one of the most important sections of the course!
- Oil, Gas, and Coal are the so called “Fossil Fuels” – 80%
- The sections are divided accordingly
- Important to note:
- Reports, Tables
- Production/Consumption
- International Trade
- Global energy prices rose sharply in 2022 driven by energy supply concerns.
Crude Oil
- Oil prices rose by around 40%
- with Brent ending the year averaging around $101/bbl.
- Global oil production:
- increased by 3.8 million b/d in 2022
- with OPEC+ accounting for more than 60% of the increase.
- Winners:
- Saudi Arabia (1,182,000 b/d) and the US (1,091,000 b/d), saw the largest increases.
- Losers:
- Nigeria reported the largest decline in production (184,000 b/d)
- Libya declined to 181,000 b/d too.
- Refining capacity increased slightly by around 534,000 b/d last year
- driven by an increase in capacity in non-OECD countries.

Natural Gas
- Natural gas prices reached record levels in Europe and Asia in 2022
- threefold in Europe (TTF averaging $37/mmBtu)
- doubling in the Asian LNG spot market (JKM averaging $34/mmBtu).
- US Henry Hub prices rose over 50% to average $6.5/mmBtu in 2022
- their highest annual level since 2008.
- LNG supply grew 5% (26 Bcm) to 542 Bcm in 2022
- similar to 2021.
- LNG supply increases came mostly from:
- North America (10 Bcm)
- APAC (8 Bcm).
- All other regions (8 Bcm)
- The increase in global LNG demand was triggered by:
- Europe (62 Bcm)
- Countries in the Asia Pacific region:
- reduced their LNG imports by 24 Bcm
- those in South & Central America by 11 Bcm.
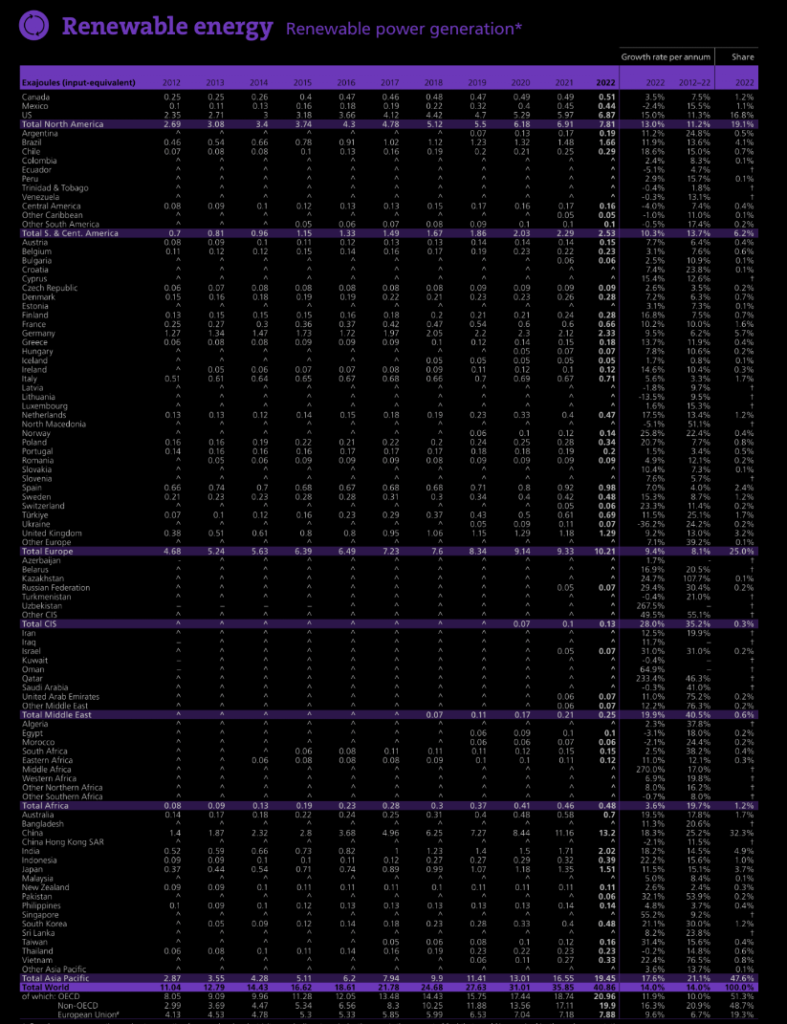
3. Renewable Energy
- Renewable power (excluding hydro):
- rose 14% in 2022 to reach 40.9 EJ.
- Below the previous year’s growth rate of 16%.
- Solar and wind capacity continued to grow rapidly in 2022
- Increase of 266 GW.
- Solar: 72% (192 GW) of the capacity additions.
- The largest portion of solar and wind growth was in China:
- about 37% and 41% of global capacity additions respectively.
- Solar and wind recorded a record increase of 266 GW in 2022 with solar accounting for 72% of the capacity additions.

4. Carbon Emissions & Electricity
Carbon Emission:
- Carbon dioxide emissions from:
- energy use, industrial processes, flaring and methane (in carbon dioxide equivalent terms)
- continued to rise to a new high growing 0.8% in 2022 to 39.3 GtCO2e
- with emissions from energy use rising 0.9% to 34.4 GtCO2e.
- energy use, industrial processes, flaring and methane (in carbon dioxide equivalent terms)
- In contrast, carbon dioxide emissions from flaring:
- decreased by 3.8% and emissions from methane
- industrial processes decreased by 0.2%.

Electricity
- Global electricity generation increased by 2.3%
- which was lower than the previous year’s growth rate of 6.2%.
- Wind and solar reached a record high of 12% share of power generation:
- solar recording 25% growth (input)
- wind power 13.5% growth (input)
- The combined generation from wind and solar once again surpassed:
- nuclear energy.

5. Closure
Amidst escalating environmental and geopolitical crises, this year’s review provides vital insights into our adaptive energy systems.
It unveils a year defined by three intertwined crises: supply, price, and climate.
Following the pandemic’s impact on energy demand, 2022 saw fresh turmoil as Russia’s actions disrupted supply assumptions, triggering global repercussions and price instability.
Simultaneously, climate change consequences heightened across continents, while global energy-related greenhouse gas emissions moved in an unfavorable direction.
The world is for sure changing a lot, and the Energy Markets can feel it.
What are your thoughts on the World Energy Review Analysis?
Are you into more? Join us in the more detailed overview of the report.
That will be it guys! I hope you enjoyed this blog post.
Is there anything in especial that you liked the most? or Maybe you are not quite into the new trends? Let me know in the comments or via e-mail!